Материал: + Optimized Regression Testusing Test Case Prioritization
Ahlam Ansari et al. / Procedia Computer Science 79 (2016) 152 – 160 |
157 |
d) Pheromone matrix
Step 2: Initially the pheromone value for each test case is calculated as:
÷ (6)
Step 3: Iterate for test cases in the test pool
Step 4: Select a test case that covers maximum fault. Check if all faults are covered by it. If not, select other test cases that cover the remaining faults.
Step 5: Terminate the iteration when all faults are covered.
Step 6: Calculate the total faults covered by test cases for all requirements and store it in the Total fault test case matrix.
Step 7: Explore all the paths in each iteration. Step 8: For each path calculate:
a)Average execution time of test case
b)Average probability of usage of test case
Step 9: Compare the paths based on average execution time of test case, average probability of usage of test case and its pheromone value.
Step 10: Select the best path.
Step 11: Update the pheromone value of the test case for the best path chosen.
7. Results
The results are bifurcated into output section which consists of various screenshots of inputs and output obtained by applying the proposed algorithm. The next section is comparison results that compares output of proposed algorithm with manual technique on different criteria.
7.1. Output
The outputs are shown below. Five test cases along with their faults uncovered and execution time is taken as input. Also the pheromone value for each test case is taken as input.
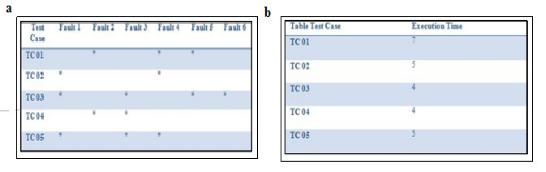
The Fault test case matrix is shown in Fig. 5 a. The faults uncovered by each test case for a particular requirement are checked and stored in this matrix. The faults which are uncovered by a certain Test case are marked as ‘*’.
Fig. 4. (a) Fault test case matrix (b) Execution time test case matrix
From Fig. 4 a it can be said that TC 03 covers maximum faults and the remaining faults are covered by TC 01. The execution time of a test case is calculated based on length of the script of the Test case. Longer the script of Test case more will be its execution time. The execution time calculated for each Test case is stored in the Execution time test case matrix. The Execution time test case matrix is shown in Fig. 4 b. Usage of a Test case is calculated based
158 |
Ahlam Ansari et al. / Procedia Computer Science 79 (2016) 152 – 160 |
on the previous usage of a Test case. Usage matrix displays the number of times a particular Test case has been in use.
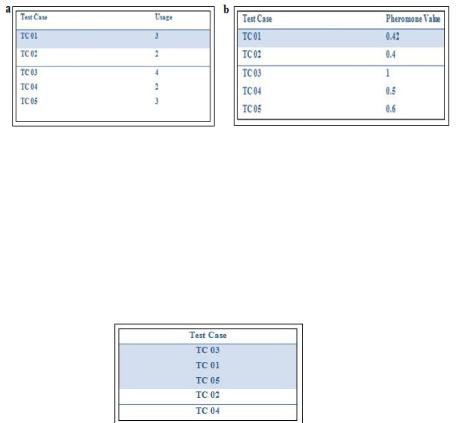
The Usage matrix is shown in Fig. 5a.
Fig. 5 a, b
From Fig. 5 a it can be concluded that Test cases TC 03, TC 01 and TC 05 are used maximum times.
The pheromone values for each Test case are stored in the Pheromone matrix. It displays the test cases and their respective pheromone values. The initial pheromone value for Test case is calculated as per Equation 6.
According to the best path selected the pheromone values are updated. Selection of best path is done based on average execution time of test case, average probability of usage of test case and its pheromone value. The pheromone matrix is shown in Fig. 5 b.
The test cases are prioritized based on their fault coverage, execution time, and usage and pheromone value. The test case that uncovers maximum faults is selected. If it does not cover all the faults, then other test case(s) which uncovers remaining faults is/are selected. The prioritized test cases are shown in Fig. 6.
Fig. 6. Prioritized test case matrix
From the results it can be seen that TC 03 and TC 01 cover all the faults of the software. Thus out of five test cases only two of them cover all the faults within minimum execution time hence the best path is selected with TC 03 and TC 01.
7.2. Comparison Results
The comparative results between proposed technique and manual testing using different criteria are shown below based on the attributes of comparison i.e. Size, Effort, Time, and Cost. The Proposed Technique optimizes test case based on multiple objectives and thereby reduces the effort, cost and time required in testing which is more in manual testing.
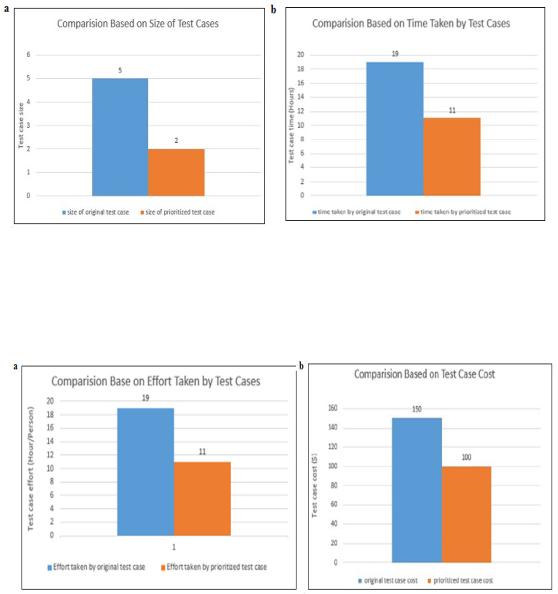
The Fig. 7 a shows the comparison between proposed technique and manual technique based on size of representative set generated.
Ahlam Ansari et al. / Procedia Computer Science 79 (2016) 152 – 160 |
159 |
Fig. 7. (a) Comparison based on size of test cases (b) Comparison based on time taken by test cases.
The Fig. 7 b shows the comparison between proposed technique and manual technique based on time taken by test cases.
The Fig. 8 a shows the comparison between proposed technique and manual technique based on effort taken by test cases.
Fig. 8. (a) Comparison based on effort taken by test cases (b) Comparison based on cost of test cases.
The Fig. 8 b shows the comparison between proposed technique and manual technique based on cost of the test cases.
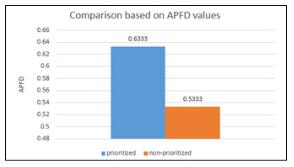
The effectiveness of the proposed algorithm will be measured by the rate of faults detected. The APFD metric is used to calculate the level of effectiveness. To calculate APFD, we consider the fault test case matrix with 6 faults and 5 test cases as shown in Fig. 4 a. Here comparison among the results of prioritized and nonprioritized test case is done based on the results of the APFD metric. The prioritized order according to the proposed technique is:
T3 T1 T2 T4 T5.
Applying APFD w.r.t prioritized test cases:
160 |
Ahlam Ansari et al. / Procedia Computer Science 79 (2016) 152 – 160 |
APFD= 1-{(1+2+1+2+1+1+1) / (5*6)}+{1/(2*5)} = 0.6333
Applying APFD w.r.t non-prioritized test cases:
APFD=1-{(2+1+3+1+1+3) / (5*6)}+{1/(2*5)} = 0.5333
Fig. 9. Comparison based on APFD values.
Thus the prioritized test cases yield better fault detection than the non – prioritized test cases as shown in the Fig. 9.
8. Conclusion
The proposed technique for test case prioritization in regression testing will automatically optimize list of test cases for a specified function to make the regression testing as efficient as possible. Test cases are prioritized and optimized using ant colony optimization technique. Prioritizing test cases will minimize the time, effort and cost of testing and uncover maximum faults in the software. Deployment of this algorithm would undeniably prove to be great reduction in the testers’ effort and time complexity.
Acknowledgement
Our thanks to M.H. Saboo Siddik College of Engineering, Department of Computer Engineering, for giving us the initiative to do constructive work. We also thank anonymous reviewers for their constructive suggestions.
References
1. Neha Sethi, Shaveta Rani and Paramjeet Singh, “Ants Optimization for Minimal Test Case Selection and Prioritization as to Reduce the Cost of Regression Testing”, International Journal of Computer Applications, 2014.
2.Yogesh Bhardwaj and Dr. Manju Kaushik, “A Review Paper on Effort Estimation and Model Based Regression Testing with SOA”,
International Journal of Computer Science and Mobile Computing, 2014.
3.Gaurav Duggal, Mrs. Bharti Suri, “Understanding Regression Testing Techniques”, Guru Gobind Singh Indraprastha University, Delhi, India.
4.Md. Mahfuzul Islam, Alessandro Marchetto, Angelo Susi Fondazione Bruno Kessler Trento, Guiseppe Scanniello, “A Multi-Objective Technique to Prioritize Test Cases Based on Latent Semantic Indexing”,16th European Conference on Software Maintenance and Reengineering,2012.
5.Bharti Suri and Shweta Singhal, “Implementing Ant Colony Optimization for Test Case Selection and Prioritization”, International Journal on Computer Science and Engineering (IJCSE).
6.Arvind Kumar Upadhyay and A. K. Misra, “Prioritizing Test Suites Using Clustering Approach in Software Testing”, International Journal of Soft Computing and Engineering (IJSCE) ISSN: 2231-2307, Volume-2, Issue-4, September 2012.
7.Gregg Rothermel, Ronal H. Untch, Chengyun Chu, Mary Jean Harrold, “Test Case Prioritization: An Empirical Study, UK”, Proceedings of the International Conference on Software Maintenance, Oxford, September 1999.
8.Chien-Li Shen and Eldon Y. Li, “Apply Ant Colony Algorithm to Test Case Prioritization”, Department of Information Management, College of Commerce, National Chengchi University, Taiwan.
9.S. Elbaum, A. Malishevsky, and G. Rothermel.(2000), ”Prioritizing test cases for regression testing”.