Материал: AD620
AD620–Typical Characteristics
1000
fA/!Hz |
|
|
|
|
|
|
|
|
|
|
|
|
|
|
|
|
|
|
|
|
|
|
|
|
|
|
|
|
|
|
|
|
|
|
|
|
|
|
|
|
|
– |
|
|
|
|
|
|
NOISECURRENT |
100 |
|
|
|
|
|
|
|
|
|
|
|
|
|
10 |
|
|
|
|
|
1 |
10 |
100 |
1000 |
|
|
|
FREQUENCY – Hz |
|
|
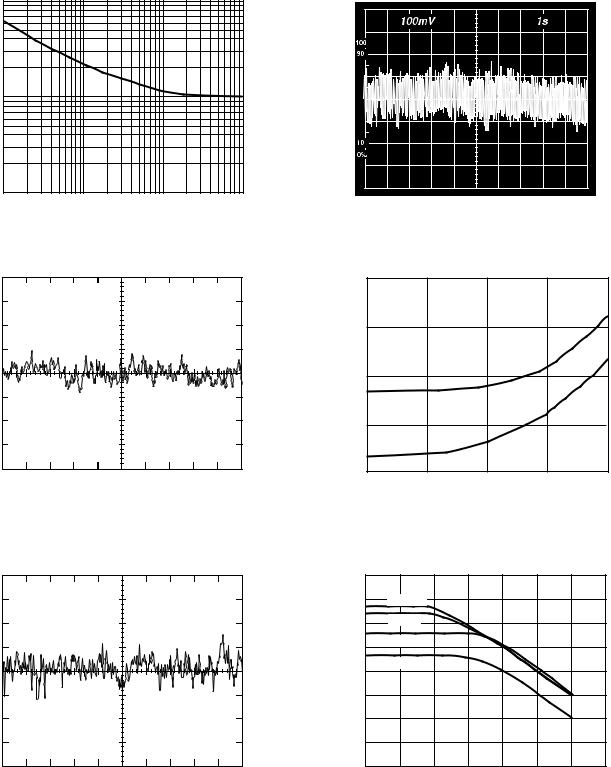
Figure 9. Current Noise Spectral Density vs. Frequency |
Figure 11. 0.1 Hz to 10 Hz Current Noise, 5 pA/Div |
|||
|
100,000 |
|
|
|
|
|
|
–mV |
|
|
|
|
|
|
RTI |
10,000 |
|
|
|
|
2.0mV/DIV |
CTO 858C, |
|
|
|
|
|
|
|
|
IN-AMP |
|
||
|
|
|
|
|
FET INPUT |
|
NOISE – |
FROM 258 |
1000 |
|
|
|
|
|
|
|
|
|
||
RTI |
DRIFT |
|
|
|
|
AD620A |
|
|
|
|
|
|
|
|
|
100 |
|
|
|
|
|
TOTAL |
|
|
|
|
|
TIME – 1 SEC/DIV |
|
10 |
10k |
100k |
1M |
10M |
|
1k |
|||||
|
|
|
|
SOURCE RESISTANCE –V |
|
|
Figure 10a. 0.1 Hz to 10 Hz RTI Voltage Noise (G = 1) |
Figure 12. Total Drift vs. Source Resistance |
0.1mV/DIV |
RTI NOISE – |
TIME – 1 SEC/DIV |
Figure 10b. 0.1 Hz to 10 Hz RTI Voltage Noise (G = 1000)
|
+160 |
|
|
|
|
|
|
|
|
+140 |
G = 1000 |
|
|
|
|
|
|
|
+120 |
G = 100 |
|
|
|
|
|
|
|
|
|
|
|
|
|
|
|
|
+100 |
G = 10 |
|
|
|
|
|
|
dB |
|
|
|
|
|
|
|
|
|
G = 1 |
|
|
|
|
|
|
|
– |
+80 |
|
|
|
|
|
|
|
|
|
|
|
|
|
|
||
CMR |
|
|
|
|
|
|
|
|
+60 |
|
|
|
|
|
|
|
|
|
|
|
|
|
|
|
|
|
|
+40 |
|
|
|
|
|
|
|
|
+20 |
|
|
|
|
|
|
|
|
0 |
|
10 |
100 |
1k |
10k |
100k |
|
|
0.1 |
1 |
1M |
|||||
|
|
|
|
FREQUENCY – Hz |
|
|
|
|
Figure 13. CMR vs. Frequency, RTI, Zero to 1 kΩ Source Imbalance
–6– |
REV. E |
|
|
|
|
|
|
|
|
|
|
|
|
AD620 |
180 |
|
|
|
|
|
|
|
|
35 |
|
|
|
|
|
|
|
|
|
|
|
|
|
G = 10, 100, 1000 |
|
|
160 |
|
|
|
|
|
|
|
|
30 |
|
|
|
|
|
|
|
|
|
|
|
p-p |
|
|
|
|
140 |
|
|
|
|
|
|
|
|
|
|
|
|
|
|
|
|
G = 1000 |
|
Volts |
25 |
|
|
|
||
|
|
|
|
|
|
|
|
|
||||
120 |
|
|
|
|
|
|
|
|
|
|
|
|
|
|
|
|
|
|
|
OUTPUTVOLTAGE – |
|
G = 1 |
|
|
|
|
|
|
|
|
|
|
|
20 |
|
|
|
|
100 |
|
|
|
|
|
G = 100 |
|
|
|
|
|
|
80 |
|
|
|
|
|
|
|
15 |
BW LIMIT |
|
|
|
|
|
|
|
|
|
|
|
|
|
|||
|
|
|
|
|
|
G = 10 |
|
10 |
|
|
||
60 |
|
|
|
|
|
|
|
|
|
|||
|
|
|
|
|
|
|
|
|
|
|||
dB–PSR |
|
|
|
|
|
|
|
|
|
|
||
40 |
|
|
|
|
|
G = 1 |
|
|
5 |
|
|
|
|
|
|
|
|
|
|
|
G = 1000 |
|
|
||
|
|
|
|
|
|
|
|
|
|
G = 100 |
|
|
|
|
|
|
|
|
|
|
|
|
|
|
|
20 |
|
|
|
|
|
|
|
|
0 |
|
|
|
0.1 |
1 |
10 |
100 |
1k |
10k |
100k |
1M |
|
1k |
10k |
100k |
1M |
FREQUENCY – Hz |
FREQUENCY – Hz |
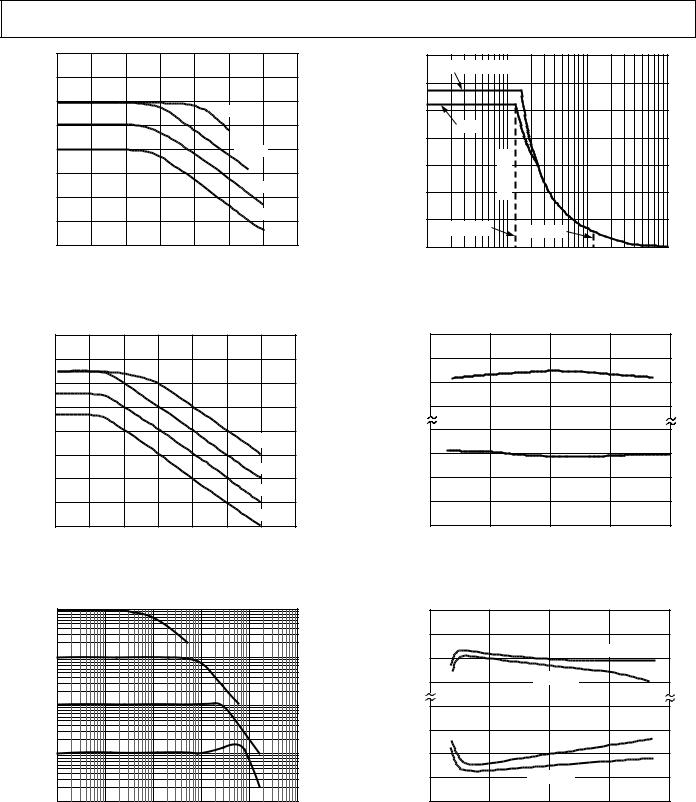
Figure 14. Positive PSR vs. Frequency, RTI (G = 1–1000) |
Figure 17. Large Signal Frequency Response |
|
180 |
|
|
|
|
|
|
|
|
160 |
|
|
|
|
|
|
|
|
140 |
|
|
|
|
|
|
|
|
120 |
|
|
|
|
|
|
|
– dB |
100 |
|
|
|
|
|
|
|
PSR |
|
|
|
|
|
|
G = 1000 |
|
80 |
|
|
|
|
|
|
|
|
|
|
|
|
|
|
|
|
|
|
|
|
|
|
|
|
G = 100 |
|
|
60 |
|
|
|
|
|
|
|
|
|
|
|
|
|
|
G = 10 |
|
|
40 |
|
|
|
|
|
|
|
|
20 |
|
|
|
|
|
G = 1 |
|
|
|
|
|
|
|
|
|
|
|
0.1 |
1 |
10 |
100 |
1k |
10k |
100k |
1M |
|
|
|
|
FREQUENCY – Hz |
|
|
|
|
Figure 15. Negative PSR vs. Frequency, RTI (G = 1–1000)
1000
100
V/V– 10
GAIN
1
0.1 |
1k |
10k |
100k |
1M |
10M |
100 |
FREQUENCY – Hz
|
|
+VS –0.0 |
|
|
|
|
|
(REFERRED TO SUPPLY VOLTAGES) |
–0.5 |
|
|
|
|
INPUT VOLTAGE LIMIT – Volts |
–1.0 |
|
|
|
|
|
–1.5 |
|
|
|
|
||
+1.5 |
|
|
|
|
||
+1.0 |
|
|
|
|
||
+0.5 |
|
|
|
|
||
|
|
|
|
|
|
|
|
|
–V +0.0 |
|
|
|
|
|
|
S |
5 |
10 |
15 |
20 |
|
|
0 |
SUPPLY VOLTAGE 6 Volts
Figure 18. Input Voltage Range vs. Supply Voltage, G = 1
|
+VS –0.0 |
|
|
|
|
|
OUTPUT VOLTAGE SWING – Volts |
(REFERRED TO SUPPLY VOLTAGES) |
–0.5 |
|
|
|
|
–1.0 |
|
|
RL = 10kV |
|
||
|
|
|
|
|||
–1.5 |
|
RL = 2kV |
|
|
||
|
|
|
|
|||
+1.5 |
|
|
|
|
||
|
|
RL = 2kV |
|
|||
+1.0 |
|
|
|
|
||
+0.5 |
|
RL = 10kV |
|
|
||
|
–V |
+0.0 |
|
|
|
|
|
S |
0 |
5 |
10 |
15 |
20 |
|
|
|||||
SUPPLY VOLTAGE 6 Volts
Figure 16. Gain vs. Frequency |
Figure 19. Output Voltage Swing vs. Supply Voltage, |
|
G = 10 |
REV. E |
–7– |
AD620
p-p |
30 |
|
|
|
|
|
|
|
|
|
|
|
|
|
|
|
|
|
|
|
|
|
|
|
|
|
|
|
|
|
|
|
|
|
|
|
|
|
|
|
|
|
|
|
|
|
|
|
|
|
|
|
|
|
|
|
|
|
|
||
|
|
|
|
|
|
|
|
|
|
|
|
|
|
|
|
|
|
|
|
|
|
|
|
|
|
|
|
|
|
|
Volts |
|
|
G = 10 |
|
|
|
|
|
|
|
|
|
|
|
|
|
|
|
|
|
|
|
|
|
|
|
|
|||
|
|
|
VS = 615V |
|
|
|
|
|
|
|
|
|
|
|
|
|
|
|
|
|
|
|
|
|
|
|
|
|||
– |
20 |
|
|
|
|
|
|
|
|
|
|
|
|
|
|
|
|
|
|
|
|
|
|
|
|
|
|
|
|
|
|
|
|
|
|
|
|
|
|
|
|
|
|
|
|
|
|
|
|
|
|
|
|
|
|
|
|
|
|
||
|
|
|
|
|
|
|
|
|
|
|
|
|
|
|
|
|
|
|
|
|
|
|
|
|
|
|
|
|
||
SWING |
|
|
|
|
|
|
|
|
|
|
|
|
|
|
|
|
|
|
|
|
|
|
|
|
|
|
|
|
|
|
|
|
|
|
|
|
|
|
|
|
|
|
|
|
|
|
|
|
|
|
|
|
|
|
|
|
|
|
|
|
|
VOLTAGEOUTPUT |
10 |
|
|
|
|
|
|
|
|
|
|
|
|
|
|
|
|
|
|
|
|
|
|
|
|
|
|
|
|
|
|
|
|
|
|
|
|
|
|
|
|
|
|
|
|
|
|
|
|
|
|
|
|
|
|
|
|
|
|
|
|
|
0 |
|
|
|
|
|
|
|
|
|
|
|
|
|
|
|
|
|
|
|
|
|
|
|
|
|
|
|
|
|
|
|
|
|
|
|
|
|
|
|
|
|
|
|
|
|
|
|
|
|
|
|
|
|
|
|
|
|
|
|
|
|
0 |
100 |
|
|
|
|
|
|
|
1k |
|
|
|
|
|
|
10k |
|||||||||||||
|
|
|
|
|
|
|
|
|
|
LOAD RESISTANCE –V |
|
|
|
|
|
|
|
|
|
|||||||||||
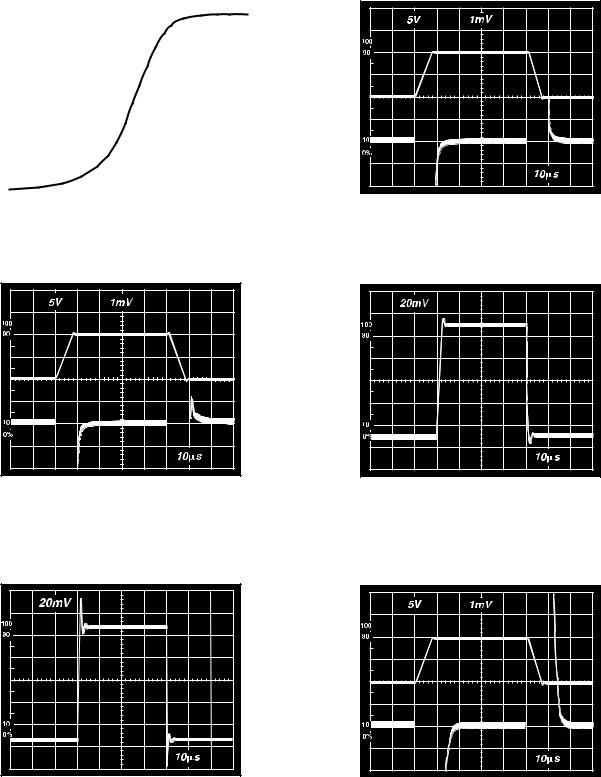
Figure 20. Output Voltage Swing vs. Load Resistance
. . . . . . . . . . . . . . . . . . . . . . . . . . . . . . . . . . . . . . . . |
. . . . . . . . . . . . . . . . . . . . . . . . . . . . . . . . . . . . . . . . |
. . . . . . . . . . . . . . . . . . . . . . . . . . . . . . . . . . . . . . . . |
. . . . . . . . . . . . . . . . . . . . . . . . . . . . . . . . . . . . . . . . |
Figure 23. Large Signal Response and Settling Time, G = 10 (0.5 mV = 001%)
. . . . . . . . . . . . . . . . . . . . . . . . . . . . . . . . . . . . . . . . |
. . . . . . . . . . . . . . . . . . . . . . . . . . . . . . . . . . . . . . . . |
Figure 21. Large Signal Pulse Response and Settling Time G = 1 (0.5 mV = 0.01%)
Figure 24. Small Signal Response, G = 10, RL = 2 kΩ, CL = 100 pF
. . . . . . . . . . . . . . . . . . . . . . . . . . . . . . . . . . . . . . . . |
. . . . . . . . . . . . . . . . . . . . . . . . . . . . . . . . . . . . . . . . |
. . . . . . . . . . . . . . . . . . . . . . . . . . . . . . . . . . . . . . . . |
. . . . . . . . . . . . . . . . . . . . . . . . . . . . . . . . . . . . . . . . |
Figure 22. Small Signal Response, G = 1, RL = 2 kΩ, CL = 100 pF
Figure 25. Large Signal Response and Settling Time, G = 100 (0.5 mV = 0.01%)
–8– |
REV. E |
|
|
|
|
|
|
AD620 |
|
|
20 |
|
|
|
|
. . . . . . . . . . . . . . . . . . . . . . . . . . . . . . . . . . . . . . . . |
|
15 |
|
|
|
|
|
|
|
TO 0.01% |
|
|
|
|
–ms |
|
|
|
|
|
|
|
|
|
|
TO 0.1% |
|
|
TIME |
10 |
|
|
|
|
|
SETTLING |
|
|
|
|
|
|
|
|
|
|
|
|
. . . . . . . . . . . . . . . . . . . . . . . . . . . . . . . . . . . . . . . . |
|
5 |
|
|
|
|
|
|
|
|
|
|
|
|
|
0 |
5 |
10 |
15 |
20 |
|
|
0 |
OUTPUT STEP SIZE – Volts
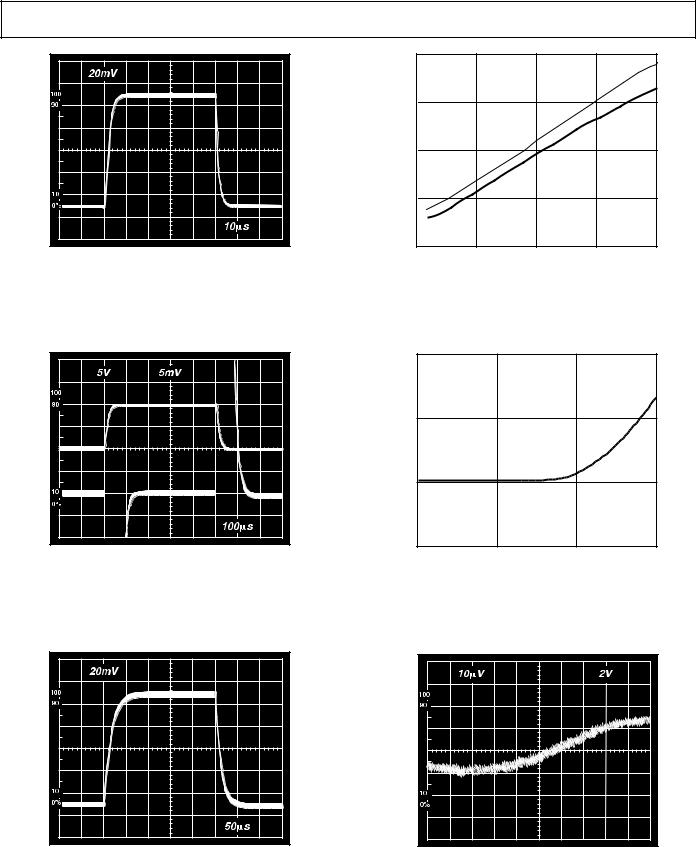
Figure 26. Small Signal Pulse Response, G = 100, RL = 2 kΩ, CL = 100 pF
Figure 29. Settling Time vs. Step Size (G = 1)
. . . . . . . . . . . . . . . . . . . . . . . . . . . . . . . . . . . . . . . . |
. . . . . . . . . . . . . . . . . . . . . . . . . . . . . . . . . . . . . . . . |
Figure 27. Large Signal Response and Settling Time, G = 1000 (0.5 mV = 0.01%)
. . . . . . . . . . . . . . . . . . . . . . . . . . . . . . . . . . . . . . . . |
. . . . . . . . . . . . . . . . . . . . . . . . . . . . . . . . . . . . . . . . |
Figure 28. Small Signal Pulse Response, G = 1000, RL = 2 kΩ, CL = 100 pF
|
1000 |
|
|
|
s |
|
|
|
|
–m |
100 |
|
|
|
|
|
|
|
|
SETTLING TIME |
10 |
|
|
|
|
1 |
|
|
|
|
1 |
10 |
100 |
1000 |
|
|
|
GAIN |
|
Figure 30. Settling Time to 0.01% vs. Gain, for a 10 V Step
. . . . . . . . . . . . . . . . . . . . . . . . . . . . . . . . . . . . . . . . |
. . . . . . . . . . . . . . . . . . . . . . . . . . . . . . . . . . . . . . . . |
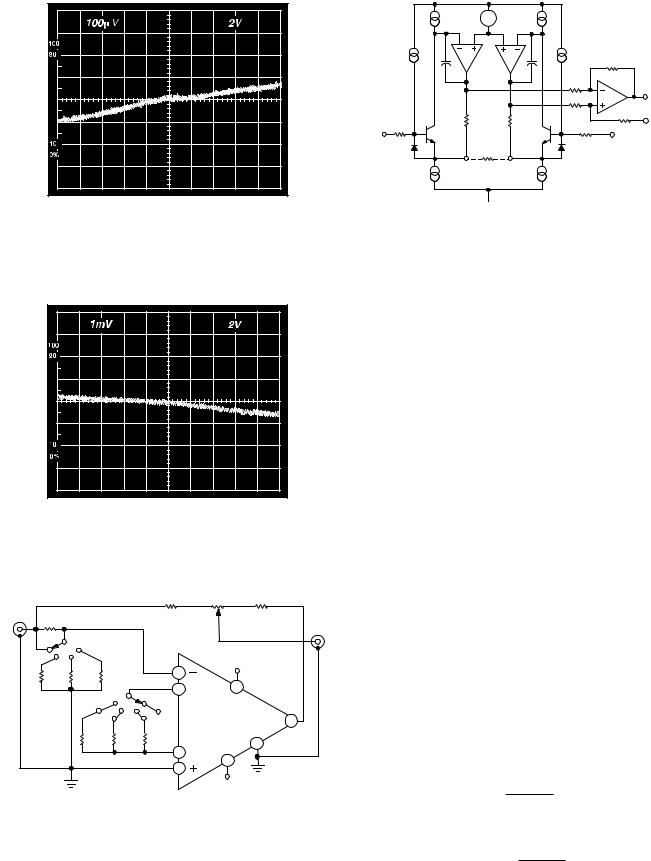
Figure 31a. Gain Nonlinearity, G = 1, RL = 10 kΩ |
(10 μV = 1 ppm) |
REV. E |
–9– |
AD620 |
. . . . . . . . . . . . . . . . . . . . . . . . . . . . . . . . . . . . . . . . |
. . . . . . . . . . . . . . . . . . . . . . . . . . . . . . . . . . . . . . . . |
Figure 31b. Gain Nonlinearity, G = 100, RL = 10 kΩ |
(100 μV = 10 ppm) |
. . . . . . . . . . . . . . . . . . . . . . . . . . . . . . . . . . . . . . . . |
. . . . . . . . . . . . . . . . . . . . . . . . . . . . . . . . . . . . . . . . |
Figure 31c. Gain Nonlinearity, G = 1000, RL = 10 kΩ |
|||||
(1 mV = 100 ppm) |
|
|
|
||
|
|
|
10kV* |
1kV |
10kV |
INPUT |
|
|
10T |
||
|
|
|
|
|
|
10V p-p |
|
|
|
|
|
100kV |
|
|
|
|
VOUT |
|
|
|
|
|
|
|
|
|
|
+VS |
|
11kV |
1kV |
100V |
2 |
|
|
|
|
|
|||
|
|
|
1 |
7 |
|
|
G=1000 |
G=1 |
|
|
|
|
|
G=100 |
G=10 |
AD620 |
6 |
|
|
|
|
|
|
|
49.9V 499V |
5.49kV |
|
5 |
|
|
|
|
8 |
|
|
|
|
|
4 |
|
|
|
|
|
3 |
|
|
|
|
|
|
|
|
|
|
|
|
–V |
|
|
|
|
|
S |
|
*ALL RESISTORS 1% TOLERANCE |
|
|
|||
Figure 32. Settling Time Test Circuit
I1 |
20mA |
VB |
20mA |
I2 |
|
|
|
A1 |
|
A2 |
|
10kV |
|
|
|
|
|
|
|
|
|
C1 |
|
C2 |
|
|
|
|
|
|
|
10kV |
|
|
|
|
|
|
|
A3 |
OUTPUT |
R3 |
R1 |
R2 |
10kV |
10kV |
REF |
|
|
|
|||||
400V |
|
|
||||
|
|
|
|
|
|
|
– IN |
Q1 |
|
|
Q2 |
+IN |
|
|
|
RG |
|
R4 |
|
|
|
|
|
400V |
|
|
|
|
GAIN |
|
GAIN |
|
|
|
|
SENSE |
|
SENSE |
|
|
|
|
|
–V |
|
|
|
|
|
|
S |
|
|
|
|
Figure 33. Simplified Schematic of AD620
THEORY OF OPERATION
The AD620 is a monolithic instrumentation amplifier based on a modification of the classic three op amp approach. Absolute value trimming allows the user to program gain accurately (to 0.15% at G = 100) with only one resistor. Monolithic construction and laser wafer trimming allow the tight matching and tracking of circuit components, thus ensuring the high level of performance inherent in this circuit.
The input transistors Q1 and Q2 provide a single differentialpair bipolar input for high precision (Figure 33), yet offer 10¥ lower Input Bias Current thanks to Superbeta processing. Feedback through the Q1-A1-R1 loop and the Q2-A2-R2 loop maintains constant collector current of the input devices Q1, Q2 thereby impressing the input voltage across the external gain setting resistor RG. This creates a differential gain from the inputs to the A1/A2 outputs given by G = (R1 + R2)/RG + 1. The unity-gain subtracter A3 removes any common-mode signal, yielding a single-ended output referred to the REF pin potential.
The value of RG also determines the transconductance of the preamp stage. As RG is reduced for larger gains, the transconductance increases asymptotically to that of the input transistors. This has three important advantages: (a) Open-loop gain is boosted for increasing programmed gain, thus reducing gainrelated errors. (b) The gain-bandwidth product (determined by C1, C2 and the preamp transconductance) increases with programmed gain, thus optimizing frequency response. (c) The input voltage noise is reduced to a value of 9 nV/ÖHz, determined mainly by the collector current and base resistance of the input devices.
The internal gain resistors, R1 and R2, are trimmed to an absolute value of 24.7 kW, allowing the gain to be programmed accurately with a single external resistor.
The gain equation is then
= 49.4 kW +
G 1
RG so that
= 49.4 kW
RG G - 1
–10– |
REV. E |