Материал: Russian Journal of Building Construction and Architecture
Russian journal of building construction and architecture
average ms(x, y, z), dispersion Ds(x, y, z) and correlation functions Кs(x1, x2, y1, y2, z1, z2) along the typical sections of the field, e.g., along the perimeter of the shell. Generally, even in the assumption on the normality of a random field implementation of the accurate model of the environment is associated with calculation problems and collection of a large amount of statistical characteristics.
There might be different simplifications of the accurate probabilistic model of the environment allowing the calculation scheme to be simplified. E.g., one of them is modelling the environment of the shell using a soil environment with elastic bonds with correlated along the perimeter stiffness characteristics. However, such a calculation scheme of the parameters of the elastic environment requires a lot of statistical data on the correlation of the parameters of the environment at different points and thus cannot be implemented as there are not any.
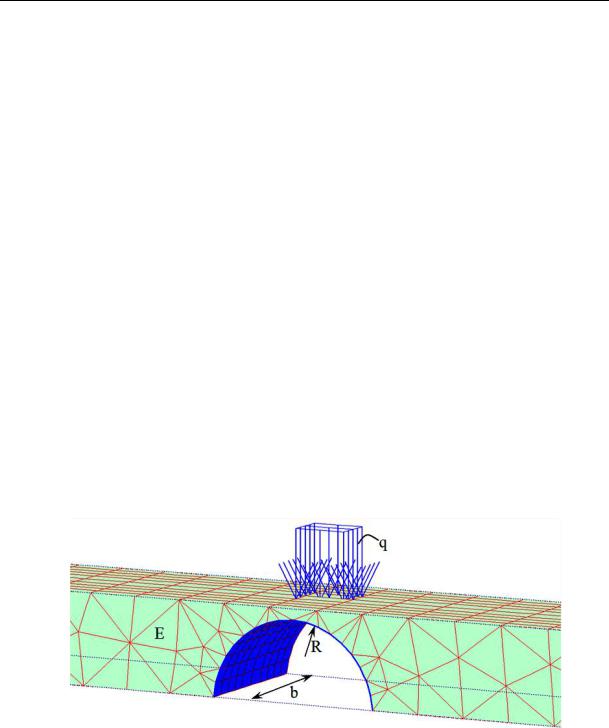
The approximated approach means a constant mathematical anticipation in the environment surrounding the shell m(x, y, z) = const and dispersion D(x, y, z) = const. The correlation of change in the parameters of the environment is not taken into account. Numerical characteristics of random value will suffice in describing the soil environment. In this paper for developing a method of probabilistic calculation, a bridge using sandy filling is presented as a non-linear finite element calculation scheme consisting of a random homogeneous area (Fig. 1).
Fig. 1. Spatial calculation scheme of a bridge using sandy filling
In describing the calculation scheme of a bridge using sandy filling, studying probabilistic positions depending on changes in bending moments М and normal forces N in the typical sections of the arch in the most inconvenient loading area will suffice for random specification of the deformation modulus of the soil environment Е. It is convenient to use the spatial
56

Issue № 2(34), 2017 |
ISSN 2542-0526 |
finite element calculation model of a bridge using sandy filling that we described in detail [1] in Plaxis [7] where there are the following assumptions:
1)The material of a bearing shell is linearly elastic;
2)Non-linear properties of the soil massive surrounding the arch bearing structure are accepted in accordance with the Mohr-Coulumb model.
2. Algorithm of a probabilistic calculation of stress-strain. In order to conduct probabilistic calculations, the method of statistical tests was employed. Despite being highly timeconsuming, it allows one to obtain viable results considering fluctuations of linear as well as non-linear determining parameters. The essence of the method of statistical testings is that there is a multi-step calculation of stress-strain of the shell under a constant load and constanly changing deformation modulus of the environment. For each calculation option the deformation modulus of the environment is considered random. Since the modulus of deformation of the soil system depends on a variety of factors (granular composition, density, humidity, etc.), we would assume that the distribution of the modulus of deformation in a probabilistic calculation scheme complies with the normal law:
|
|
1 |
|
(E m2E ) |
2 |
|
|
|
PE |
|
exp |
|
, |
(1) |
|||
E |
2 |
|||||||
|
|
2 E |
|
|
|
where mE and σE are mathematical ancipitation and standard of random deformation modules respectively.
The calculation of the stress-strain of the shell in the elastic and plastic environment using a spatial calculation scheme by means of the method of statistical testings includes the following steps:
––Generation of random modules of deformation E of the bearing shell surrounding the soil environment;
––A non-linear statistical calculation of the stress-strain of the shell using Plaxis [7] for a spatial non-linear finite element calculation scheme of bridges using sandy fillings;
––Accumulation of statistical data of the parameters of maximum efforts in the typical sections of the bearing structures for follow-up calculations for different modules of deformation Е. Equalling statistic distributions choosing the most appropriate analytical distribution laws [9]. For numerical calculations along with the normal distribution law we use the general betalaw where density is determined using the formula:
f (x) |
Г(C1 |
C2) |
xC1 1(1 x)C2 1,(0 x 1). |
(2) |
||
|
|
|||||
|
Г(C )Г(C |
2 |
) |
|
|
|
|
1 |
|
|
|
|
|
57
Russian journal of building construction and architecture
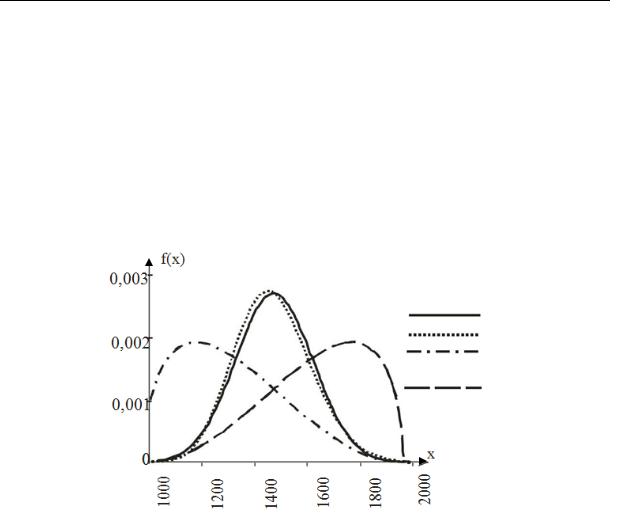
In expression (2) for the density of betadistribution there are also special functions Г(х) for which the mathematical software MathCAD is employed. Formula (2) suggests that the betalaw has two parameters С1 and С2 that have an effect on the graph of the density of the distribution law. The theory [6] shows that at С1 > С2 distribution has a negative asymmetry and when рас С1 = С2 that has a negative asymmetry, for С1 < С2 is a positive asymmetry, for С1 = С2 distribution has a symmetrical shape. Fig. 2. Shows the graphs of the density distribution that were used to equal the histograms of random efforts in the typicall sections of the arch in the elastic environment.
Normal law
Lognormal law General betalaw with positive asymmetry
Generalized betalaw with a negative asymmetry
Fig. 2. Density distribution of different laws
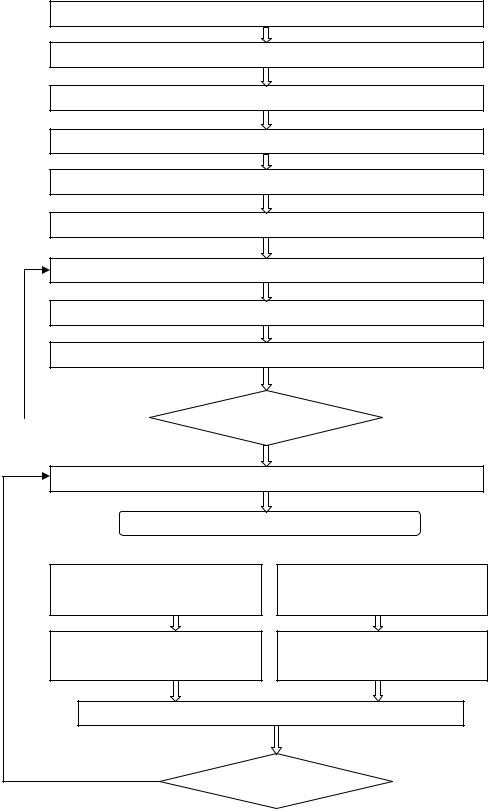
The block scheme of the probabilistic calculation of the soil-filling structure under a statistica time load based on the method of statistical testings is presented in Fig. 3. Time loads are modelled equally on a local area of the filling distributed on the surface using random load intensity q (see Fig. 1).
3. Numerical realization of the method of probabilistic calculation of stress-strain. The method will be tested using the example of a model of a bridge using sandy filling with a ferroconcrete arch span structure with the following geometric parameters: the bridge span is 12.0 m, curvature is 6.0 m, arch of the slope is 5.5 m, the thickness of the arch is 0.3 m. Numerica; calculations using the method of statistical testings of the distributed intensity q = 113.6 kN/m2, applied to the average section along the length. In the initial distribution of the deformation modulus of the soil environment the following parameters are accepted: the range Е = 6…52 МPа. The massive out of 200 random values of the deformation modulus dis-
58
Issue № 2(34), 2017 |
ISSN 2542-0526 |
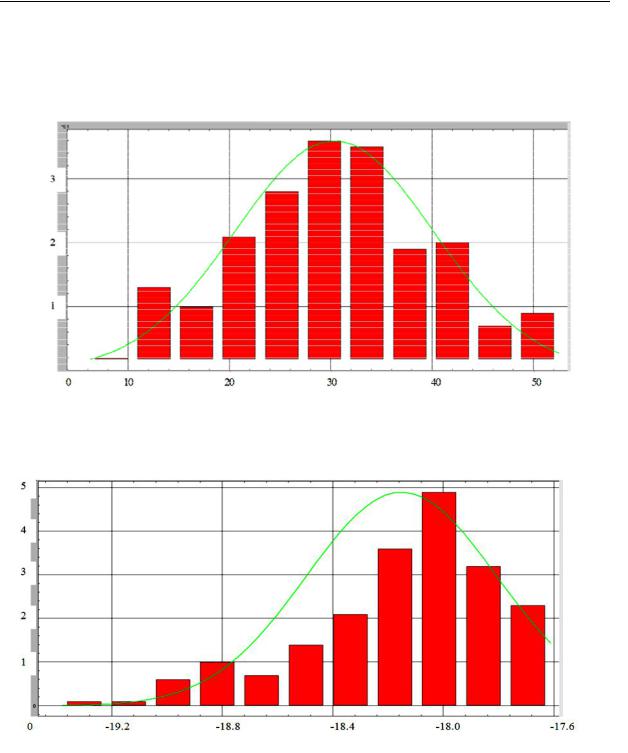
tributed according to the normal law (1) with the parameters mЕ = 40 МPа and standard σЕ = 10 МPа were obtained by means of numerical generation usingStadia software [8] (Fig. 4).
Specification of determined parameters of the calculation scheme of a structure
Implementation of the calculation scheme using the Finite Element Library
Choice of the typical sections and calculation parameters
Choice of the position of a time load on a structure
Generation of the massive of random deformation module of the filling E
Choice of the number of calculation options
Choice of a random E out of the generated massive
Non-linear calculation of the structure for the chosen random E
Arrangement of the calculation parameters in isolated massives
|
i = i + 1 |
|
Option reader |
|
|
|
|
|
|
|
|
Choice of one of the stored massives out of the calculation parameters
Testing the normality of the distribution of the values Yes 

Calculation of the parameters of the normal law mx and ox
Determining the maximum calculation parameter x = mx + 1.6σx
Archiving the results of the calculations
Reader of the calculat- |
|
|
|
STOP |
|||
ed parameters |
|||
|
|||
Fig. 3. Block scheme of the probabilistic calculation of a bridge using a sandy filling
59
Russian journal of building construction and architecture
For the illustration in Fig. 5 there is a histogram of the distribution of the bending moments in the support section of the arch under a time load placed in the middle of the span of a bridge using a sandy filling that was obtained based on the results of probabilistic calculations.
E, MPa
Fig. 4. Initial distribution of random modules of deformation of the soil filling generated according to the normal law
M, kNm · m
Fig. 5. Histogram of the distribution of the bending moments in the support section of the arch from a time load positioned in the middle of the span of a bridge using a sandy filling
The following conclusions were made based on the results of the numerical calculations:
1. A range of normal efforts in the support section of the arch as well as that in the fourth of the span is in good agreement with the normal law of the distribution only for a clutch section.
60